
Financial Clarity: Understanding Your Reports Without the Headache
- Mary Davis

- 5 hours ago
- 5 min read
You've probably looked at your QuickBooks reports and thought, "I know these numbers mean something, but what exactly?" You're not alone. Financial reports can feel like they're written in a different language: one that everyone assumes you already speak.
Here's the thing: understanding your financial reports doesn't require an accounting degree. It just requires knowing what you're looking at and why it's structured the way it is.
The Two Reports That Actually Matter
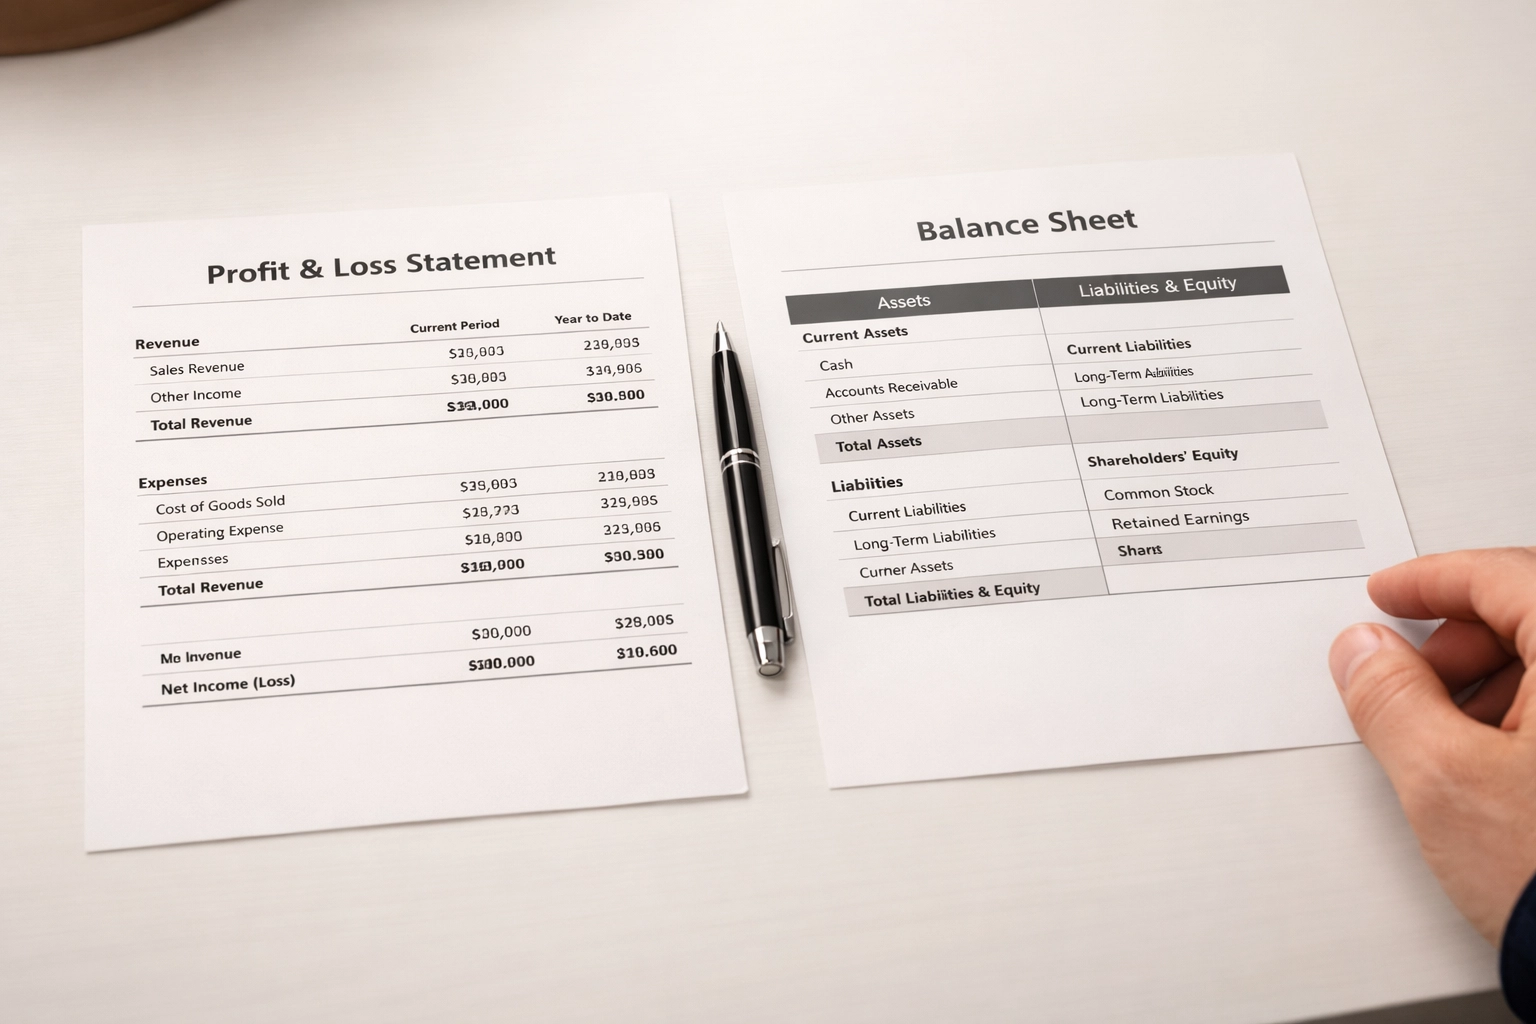
While QuickBooks can generate dozens of reports, there are really only two you need to understand deeply: your Profit & Loss Statement (P&L) and your Balance Sheet.
These aren't just documents your accountant wants at tax time. They're telling you different stories about your business: stories that help you make better decisions about hiring, spending, and growth.

Your P&L: The Performance Report
Think of your Profit & Loss Statement as your business's report card for a specific time period: usually a month, quarter, or year. It answers one simple question: Did we make money or lose money?
Here's how it flows:
Revenue sits at the top. This is all the money your business brought in during the period.
Cost of Goods Sold (COGS) comes next. These are the direct costs tied to delivering your product or service: materials, direct labor, shipping costs.
Gross Profit is what's left after subtracting COGS from revenue. This number tells you how profitable your core offering actually is.
Operating Expenses include everything else: rent, utilities, salaries, software subscriptions, marketing.
Net Income is what remains at the bottom. This is your actual profit (or loss) after everything is accounted for.
The P&L is chronological. It starts with money coming in and systematically subtracts everything that went out. That's why accountants call the bottom line just that: the bottom line.
Your Balance Sheet: The Snapshot
If your P&L shows performance over time, your Balance Sheet shows your financial position at a single moment in time: like taking a photograph of your business's financial health.
The Balance Sheet has two sides that always balance (hence the name):
Assets (what you own):
Current Assets: Cash, accounts receivable, inventory: things you can convert to cash within a year
Fixed Assets: Equipment, vehicles, property: longer-term holdings
Liabilities & Equity (what you owe and what you've built):
Current Liabilities: Accounts payable, credit card balances, short-term loans
Long-Term Liabilities: Mortgages, long-term loans
Owner's Equity: What's left after subtracting liabilities from assets: essentially what the business is worth to you
The Balance Sheet follows a simple equation: Assets = Liabilities + Equity. If it doesn't balance, something's wrong in your books.
Why Your P&L and Bank Balance Don't Match
This confuses almost everyone at first. You show a profit on your P&L, but your bank account looks nothing like that number. Or you're "losing money" according to QuickBooks, but you've got plenty of cash.
Here's why:
Accrual vs. Cash Accounting
Most businesses use accrual accounting for their financial statements. This means revenue is recorded when you invoice a client, not when they pay you. And expenses are recorded when you receive a bill, not when you pay it.
Your bank account, however, only shows cash: actual money that moved in or out.
So if you invoiced $50,000 in January but only collected $30,000, your P&L shows $50,000 in revenue while your bank account only increased by $30,000. Both numbers are correct: they're just measuring different things.
Non-P&L Transactions
Some transactions affect your bank balance but don't touch your P&L at all:
Loan payments (the principal portion)
Owner draws or distributions
Asset purchases
Credit card payments
When you buy a $10,000 piece of equipment, that full amount leaves your bank account immediately. But on your P&L, you might only see depreciation expense: maybe $2,000 that year. Your Balance Sheet shows the equipment as an asset, but your P&L doesn't reflect the full cash outflow.
This is why bookkeeping services focus on both reports. They tell different parts of your financial story.
Reading Between the Lines
Once you understand what each report shows, you can start asking better questions:
From Your P&L:
Are my margins healthy? (Look at gross profit as a percentage of revenue)
Which expense categories are growing faster than revenue?
Am I actually profitable, or just busy?
From Your Balance Sheet:
Do I have enough cash and receivables to cover my short-term obligations?
Is my accounts receivable balance growing because customers aren't paying?
How much debt am I carrying relative to what I own?
From Both Together:
If I'm profitable but always short on cash, where's the money going?
Should I be investing in more equipment, or do I need to collect receivables faster?
The Reports Your Bookkeeper Cares About
Professional bookkeeping services pay attention to a few other reports that help keep everything accurate:
Cash Flow Statement tracks actual cash movement across three categories: operating activities (day-to-day business), investing activities (buying or selling assets), and financing activities (loans and owner contributions). This bridges the gap between your P&L and bank account.
Accounts Receivable Aging shows which customers owe you money and how overdue their invoices are. If this report is growing, you've got a collections problem, not a revenue problem.
Accounts Payable Aging shows who you owe and when payments are due. This helps you manage cash flow and avoid late fees.
These supporting reports don't replace your P&L and Balance Sheet: they help explain what's happening in them.

Common Red Flags in Your Reports
Even without deep accounting knowledge, you can spot problems:
On Your P&L:
Negative gross profit (you're selling at a loss)
Operating expenses growing faster than revenue
Wildly inconsistent monthly revenue with no seasonal explanation
On Your Balance Sheet:
More current liabilities than current assets (liquidity problem)
Negative equity (the business owes more than it owns)
Accounts receivable older than 60 days growing each month
Between Both Reports:
Showing profit but equity is decreasing
Revenue growing but cash position getting worse
These aren't just accounting issues: they're business issues that need attention now.
Making Reports Actually Useful
Understanding your financial reports isn't about becoming an accountant. It's about knowing what questions to ask and where to find the answers.
When your reports are accurate and you know how to read them, you can:
Make hiring decisions based on actual profitability, not just bank balance
Identify cash flow problems before they become crises
Understand which parts of your business are actually making money
Have productive conversations with your CPA or financial advisor
The goal isn't perfection. It's clarity. And clarity comes from knowing what you're looking at and why it matters.
If your reports currently feel like a foreign language, that's not a personal failing: it's just a gap in your toolkit. Most business owners learned how to deliver their product or service, not how to read financial statements. That's why quality bookkeeping services exist: to make sure your reports are accurate and actually tell you what's happening in your business.
Once you understand the basics: what a P&L measures versus what a Balance Sheet shows, why accrual accounting creates timing differences, and which numbers actually matter for your decisions: financial reporting becomes a lot less intimidating.
Your reports should work for you, not confuse you. And now you know where to start.

Comments